
Best Buy or Sell Crypto Indicators for Trading and Scalping
Using technical indicators, you are able to explore price fluctuations and signs of trends in the unstable crypto environment.


Traditional financial markets are tightly
knit, where changes in prices can be easily forecasted due to standardized
features. However, Crypto markets fluctuate frequently due to their volatile
nature and vulnerability to news or regulatory changes or sentiment.
Whenever trading cryptocurrencies, you want to
make sure that you are on the right side of the loop so that you do not miss
the most profitable deals. Using technical indicators, you are able to explore
price fluctuations and signs of trends in the unstable crypto environment.
Therefore, they give a better chance to predict the tendencies of the future
and make wiser financial decisions.
Best Buy or Sell Indicators for Crypto Trading
Since the cryptocurrency market is still a novel phenomenon to many, newcomers, as well as experienced players in the market, are adviced to educate themselves thoroughly about various technical indicators. Having a well-planned strategy and using indicators effectively can help traders maximize their profits while mitigating the risk simultaneously.
Best Indicators for Crypto Day Trading
Day trading requires quick decisions based on
short-term market movements. Here are some of the best indicators for crypto
day trading:
1. Exponential Moving Average (EMA)
A technical indicator that demonstrates how an asset
or a security price fluctuates within a period of time. Exponential Moving
Average (EMA) is a technical chart indicator that generates the buy and sell
signals based on the price of a specific security over a given time frame.
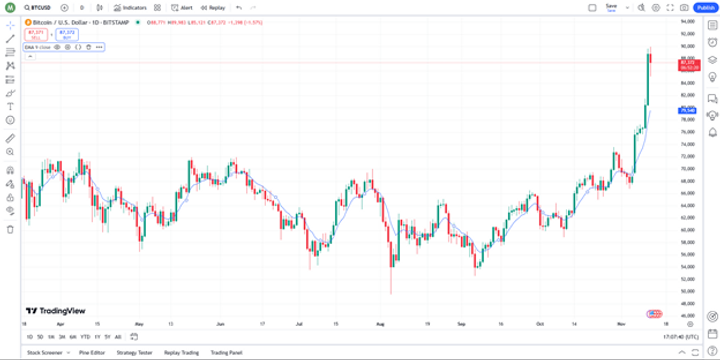
EMA formula determines buy and sell signals
based on divergences and crossovers in the past average. The EMA is plotted
over different periods and generates different signs depending on the period
chosen. The EMA falls under the moving average indicators. As against the
Simple Moving Average, the EMA emphasizes the recent price data more than the
older price data.
2. Relative Strength Index (RSI)
The Relative Strength Index (RSI) is a momentum indicator that depicts the latest price
trends since values range from 0 to 100. It considers the rate of
the recent price movements to establish whether the stock is due for an upswing
or a downturn.

This indicator gives short-term buy and sell
signals and helps monitor an asset's overbought and oversold values. Values
below 30 are mainly associated with the buy signal concerning an oversold or an
undervalued situation. A reading of above 70 means that a high RSI triggers a
sell signal that tends to indicate that security is over-bought or overvalued. It
is advisable for every investor to learn to look at the figures and
interrelations absolutely to give a numerical value of 50 as neither bullishly
nor bearishly positioned.
3. Moving Average Convergence Divergence (MACD)
MACD gives two indications – the direction of the
trend and the momentum of the trend. This is particularly important in the
crypto market because swings in its trends frequently occur before a change in
its prices. MACD consists of a MACD line, signal line, and histogram.
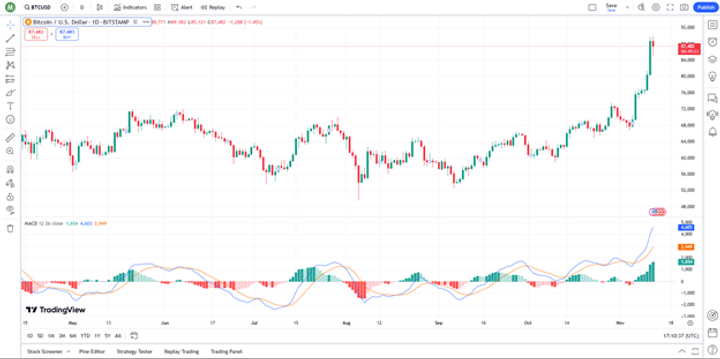
There are buy or sell signals when the MACD line crosses the signal line in the direction of trade. For instance, when the
MACD line rises above the signal line, then it may indicate the beginning of an
upward move. Also, the histogram provides the distance between the MACD and
signal lines and helps traders determine the strength of momentum in a trend.
Best Buy or Sell Indicators for Crypto
Scalping
Scalping is probably the most widespread
trading strategy that aims at making many deals within a short period of time
to profit from temporary price movements. The following indicators can help
scalpers make instant decisions.
1. Bollinger Bands
A Bollinger Band is made up of a middle band,
which is a moving average and an upper and lower band. These upper and lower
bands are placed above and below the moving average by a fixed number of
standard deviations of price, meaning volatility is included.
The general rule of thumb is that by looking at
the position of the stock in relation to the two bands, a trader might be in a
position to tell whether a stock price is low or high compared to an average
price. More so, the width of the band can also be information about how
volatile the band is; narrow bands usually give low volatility, and wider bands
give higher volatility.
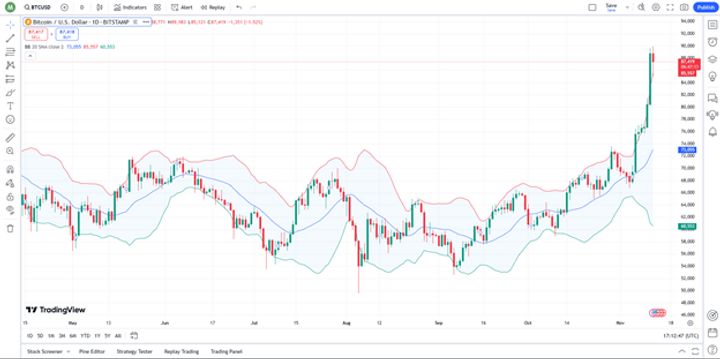
Bollinger Bands use an average of 20 periods, where each period can mean 5 minutes, an hour or a day. As the moving average
is generated, the upper and lower bands are initially set at two standard
deviations away from the line. However, traders are allowed to adjust the
number of periods in the moving average and the number of deviations as well.
2. Stochastic Oscillator
The Stochastic oscillator or stochastic indicator is a
trading tool for identifying trend reversal. The Stochastic Oscillator is a
meter that signals the level of the most recent closing point of a security
compared to the highest and lowest rates in some period of time. They come up
with readings that vary between 0 and 100 to give more information on the
momentum of the security.
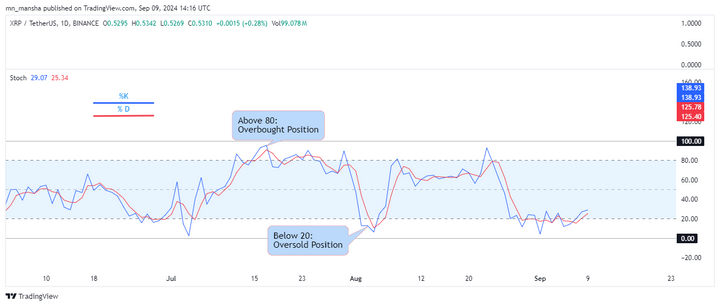
The stochastic readings are simply percentile
representations of where security has been trading within a specific time
frame. This Stochastic Oscillator is set for 14 time periods, which can be
hourly, daily, and other times. A negative value signifies the lowest end of a
trading range, while the Positive is the highest end of a trading range. It
means that any score above 100 represents the maximum recorded in the entire
specified timeframe.
3. Volume Weighted Average Price (VWAP)
Volume Weighted Average Price is a moving average price
of a stock based on the volume of transactions. The VWAP is used to identify
the average price level of a stock during a particular time frame. The
volume-weighted average price assists in translating the current stock price
with a benchmark so investors know when to get in and out of the market.
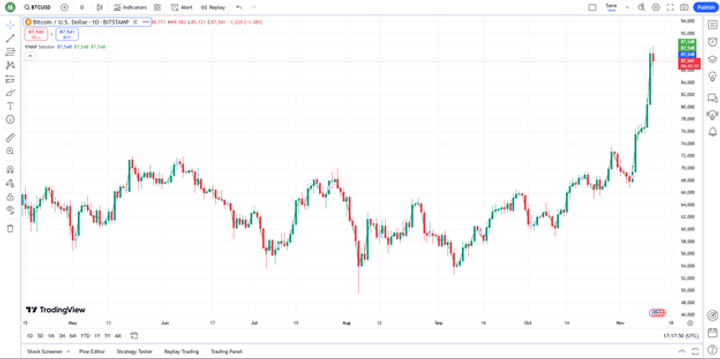
Moreover, the VWAP can help investors decide
on a particular position to take on a stock and make the correct trade at the
correct moment. The volume-weighted average price is then calculated for a day.
It operates when the markets are functioning during the day and shuts down
immediately after the markets close for the night. Because it is done on a
daily basis, intraday data is used in the calculation.
Top Buy or Sell Indicators on TradingView for Crypto Trading
TradingView is a popular platform offering a
wide range of indicators. Here are some of the best indicators for crypto
trading on TradingView:
1. Ichimoku Cloud
Ichimoku Clouds is a technical analysis tool
developed by Goichi Hosoda in the 1960s. It uses multiple variables to reveal
signals of support, resistance, trend direction, and momentum to provide more
data points than the standard charts for the prediction of price volatility.
The Cloud has five components: the Tenkan-Sen,
a 9-period moving average for short-term trends. Kijun-Sen, a 26-period average
used as a support/resistance. Senkou Span A, the midpoint between tenkan-sen
and kijun-sen plotted 26 periods ahead, forms part of the cloud and acts as a
support or resistance line. Senkou Span B, a 52-period high/low average, also
plotted 26 periods.

All these combined provide the so-called
“Kumo,” which helps to understand the trend strength and its direction;
therefore, the indicator is used by professional traders.
2. Fibonacci Retracement
Retracement levels refer to Fibonacci numbers
that draw horizontal lines on charts representing possible levels of support or
resistance.
These levels are percentages that indicate the
magnitude of consolidation in relation to the preceding peak. All numbers are
derived from Fibonacci ratios. Some of the commonly employed constructions are
23.6%,38.2%, 61.8%, and 78.6 %, although the 50% level is normally used even
though it is not a Fibonacci ratio.
This indicator can be used between two
significant price levels, including the current highest and the lowest, to get
an automatic level in between. For instance, if a stock is up by $15 and then
down by $3.54, it has retraced 23.6 %, which gives a Fibonacci level. These
numbers, which are present in natural numbers, are regarded by many traders to
have a similar impact on the markets.
3. Volume Profile Indicator
The Volume Profile or Volume-by-price is a
technical tool of analysis that visually describes trading volumes for various price levels within the period considered.
Volume Profile will have horizontal bars on
the side of the price chart, each bar indicating the volume transacted at a
given price level. This information is helpful for traders in knowing their
support and resistance levels in high and low trading zones.
The Volume Profile also shows that high peaks
represent high price levels and that low valleys mark areas of lesser trade
interest. Due to the integration of volume data, the Volume Profile provides
essential information concerning market attitude and possible trend reversals
to make better decisions about trades.
How to Combine Indicators for More
Accurate Buy/Sell Decisions
Using multiple indicators together often
improves the reliability of buy or sell signals. For example, pairing a trend
indicator like EMA with a momentum indicator like RSI can help validate trends
and timing.
Similarly, using MACD with VWAP can provide
insight into momentum and price equilibrium, supporting informed entry or exit
points. However, too many indicators can clutter your analysis, so use a
combination that balances clarity with accuracy.
Conclusion
Choosing the right indicators is the key to creating a strong crypto trading strategy. All types of trading strategies, including day trading and scalping, require an in-depth understanding of technical indicators in order to understand price history and predict the possible price action effectively.
Moreover, experts suggest that the
incorporation of relevant indicators in a trading strategy makes it much more
successful.
Discover more from CoinageReport
Subscribe to get the latest posts sent to your email.
This article is for informational purposes only and is not financial advice.


