
Ethereum Classic Registers Huge Losses in a Day. What’s Next?
The crypto market is a brutal place to be when bears are controlling things. Ethereum Classic is the victim of a bearish cycle in which it lost more than 20% in a single day.


Ethereum Classic is the hard fork of the Ethereum network which launched in 2016. The main functionality of this network is to host smart contracts and decentralized applications (dApps). This network was part of the second largest crypto asset ecosystem, but things have changed a lot since the inception of the blockchain. We will explore how things are working out for this network so far. But first, let’s take a look at the current market situation of Ethereum Classic.
What’s Happening With ETC?
After an impressive rally a few days ago, Ethereum Classic seems to be under the control of the bears. The asset lost its key support at around $30 and registered losses of more than 17% in a day. However, as of now, the asset is recovering with a loss of more than 8%. The tug of war between the bears and bulls continues as bulls are trying to get the key support of $30 while bears want to keep things low. Data from CoinGecko reveals investors have added more than $140% to the asset’s daily trading volume. ETC has lost more than 22% in a week. Historical data reveals that the price of the asset has plunged more than 80% from its ATH of a year ago.
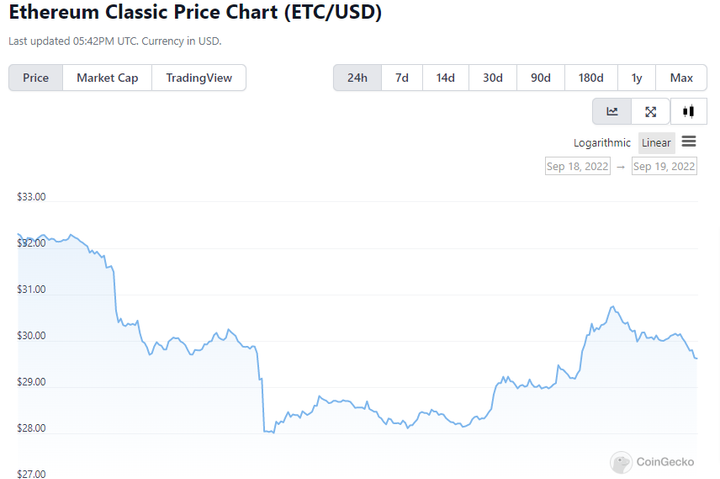
CoinGecko
Recently, the main Ethereum network shifted to the Proof of Stake (PoS) consensus mechanism. The hashrate for the Ethereum Classic saw a rise of more than 250%.
Let’s look at the fundamental and technical sides to see what can happen next in the ETC ecosystem.
What’s next for Ethereum Classic?
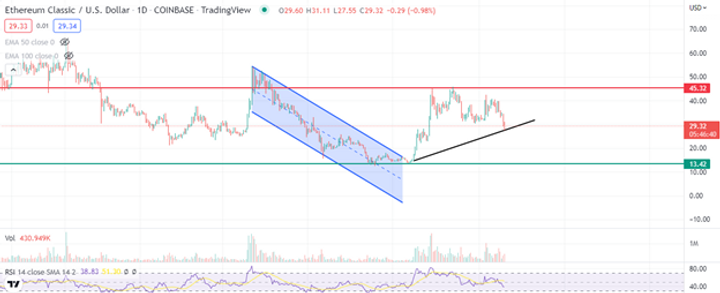
Ethereum Classic [ETC] experienced erratic volatility over the previous two months as it remained within the $30–$43 price range. The currency lost its $30 baseline support, indicating that the bears may have returned to the market after bagging huge gains in its recent rise.
In the most recent days, ETC dropped below the daily 20/50/200 EMA, indicating a significant selling bias. Until buyers enter the market and drive up buying volumes, its current southern voyage may continue testing new lows. As of the time of publication, the alternative traded at $28.05, down a startling 17.22% from the previous day alone.
TradingView
After recently reversing from the $38 resistance, ETC fell below its EMAs and returned to the downward trend. Over the past four days, the asset's price has fallen by almost 30%.
This fall dragged ETC below the crucial $30–$32 level and below its area of high liquidity. A bearish crossover with the 50/200 EMA would further confirm the increased selling intensity with the 20 EMA (red) pointing south. Additionally, on September 18 when it turned red, the Supertrend modified its posture to represent a sell signal. A persistent decline below $28.4 would probably fuel a continuing slump. In this instance, buyers should anticipate a short-term recovery from the $24–$26 level in the upcoming sessions.
The buyers may benefit from the 20 EMA's failure to go below the 50 EMA to avoid a protracted carnage. The purchasers would seek to retake the critical $32-level in these conditions. Let’s look at the technical indicators to understand the reason behind these claims.
What’s the Reason?
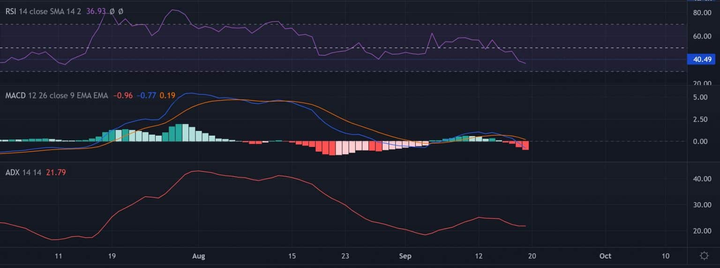
Indicating a strong selling edge, the Relative Strength Index (RSI) lingered below the 40 region. Before a possible turnaround, a persistent decrease may reach a plateau in the oversold area.
TradingView
The MACD line (blue) also fell below zero to coincide with the bearish readings on the RSI. The descent of the signal line (orange) below equilibrium would confirm the bearish bias apparent at press time. However, the ADX showed only a minor directional trend for the alternative.
Conclusion:
A favorable environment for the bears has been created by ETC's bearish break below the EMAs. From the aforementioned targets, a short-term retreat might offer prospects for a rebound. Additionally, the on-chain developments and the general market attitude will be key factors in determining future movements. To find any bearish invalidations, this study is essential.
Discover more from CoinageReport
Subscribe to get the latest posts sent to your email.
This article is for informational purposes only and is not financial advice.


