
Where is the Bitcoin price heading this week?


Bitcoin bulls are grinding to push price back above $22,000, while bears keep testing whether $18,000 support finally breaks. Here’s a closer look at what’s actually driving the tug-of-war.
Bitcoin social sentiments: Fear and Greed Index
If we take social sentiments into account, there’s still a lot of fear in the crypto market as new buyers and institutions are not buying the dip due to the hovering danger of further dip. The index fell to 6, scoring the most fear recorded on June 18 when Bitcoin dipped to $17600. Even Bitcoin long-term holders capitulated, selling their Bitcoin at a loss. Out of 500k Bitcoins sold, at least 150K Bitcoins were sold by the longer-term holders.

As Bitcoin recovered and made up to $22,000 recently, the index showed a similar response: it’s now at 18, up from 11 the week before. The situation is still scary but is getting better. As the weekend approaches, the market might witness increased volatility and there will be a profound shift in the fear and greed indices as well in the coming days. Will the direction be positive or negative? We’ll look at that in the next part of this blog.
Bitcoin Short vs long positions
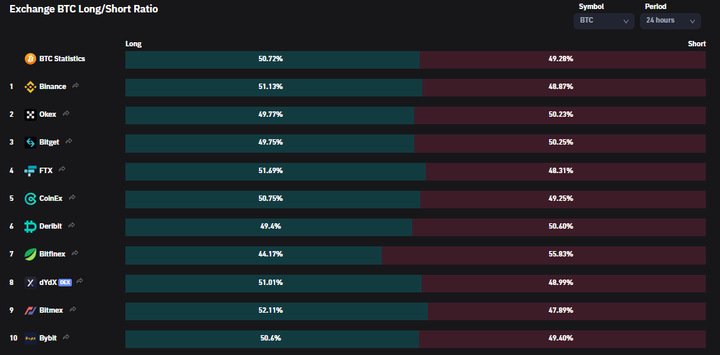
Exchange BTC Long/Short Positions Coinglass
Bitcoin is in the driving seat when it comes to the cryptocurrency market. The long/short ratio in future contracts gives a clearer picture of what people are expecting from the market. Bitfinex is extremely bearish about Bitcoin, but almost all other exchanges have more long positions opened than shorts. This suggests that people are positive about Bitcoin for at least 24 hours. But it’s still unclear how much it can rise and where the support and resistance levels are.
Bitcoin’s current situation
The weekly Bitcoin chart shows that the price is gradually rising in a parallel channel and trying to break above the local resistance levels. Bitcoin has a local resistance level of $22,800. Though there are green candles visible on the chart and the price is rising on a bullish trend line, it looks like Bitcoin is repeating the pattern of previous weeks when it showed a little reversal and then recorded a lower low. If this pattern is repeated, the next low can be as low as $17,400, the bottom of the current cycle. The expiration of Bitcoin futures contracts might further push the price downwards, recording a newer low.
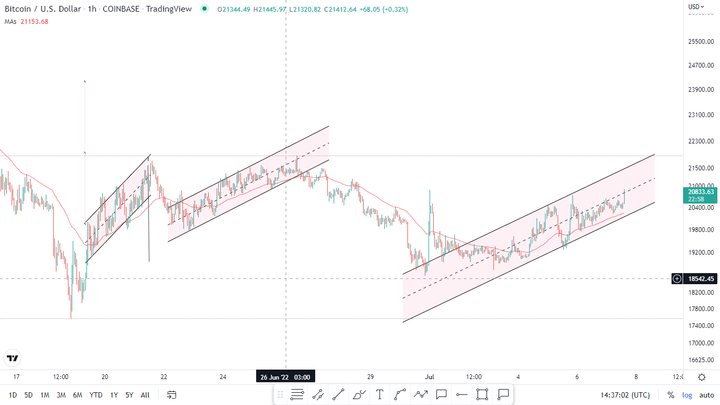
Bitcoin Hourly Chart
How about the long-term analysis? When will this bearish market turn green? For that purpose, let’s change the hourly chart to a weekly chart.
Bitcoin price prediction for this week
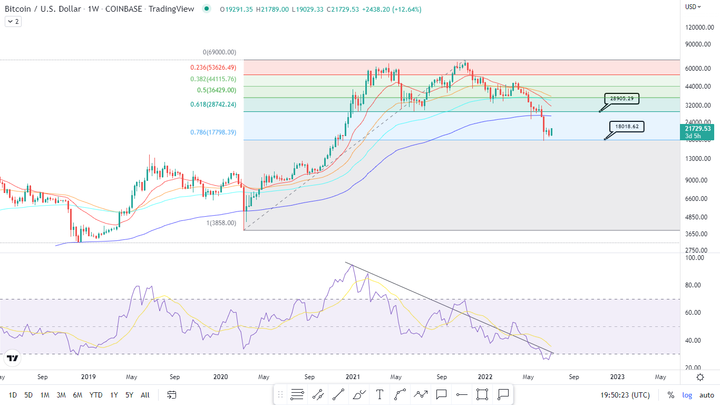
Bitcoin Weekly Chart
There’s a lot to check on the weekly chart – there are Fibonacci levels, there are Moving Averages and then there’s this Relative Strength Index (RSI).
On a weekly chart, EMA 200 has been working as good support, but now that Bitcoin is ranged below it, this has turned into resistance. Bitcoin is apparently closing the week with a bullish engulfing green weekly candle. This candle is the first indication of a trend reversal. Since the previous trend was a bearish one, the reversal might trigger a bullish rally towards the next resistance level.
Considering good support at fib 0.786, around $17900 on a weekly chart, the major support level is $29000, fib 0.618 on the weekly chart. Breaking above this level can declare Bitcoin bullish on a long-term basis. Bears seem to fail to record a newer lower low below $17,500, so if this time Bitcoin drifts low, it is likely to record a higher low instead at $18500.
The Relative Strength Index has been in a continuous decline over a bearish trendline but it broke below the support level and entered an oversold situation. The index is recovering and rising to the trendline again. If RSI crosses above this level, Bitcoin can easily touch the $25,000 mark; however, to sustain that gain is another story.
This analysis is an editorial opinion and not financial advice. Always DYOR before investing.
Discover more from CoinageReport
Subscribe to get the latest posts sent to your email.
This article is for informational purposes only and is not financial advice.


