
XLM might Follow This trajectory if Bears Can Get in the Driver’s Seat
The native asset of the Stellar ecosystem held its ground during the recent turmoil in the crypto market. However, XLM might follow a bearish path if bears can get hold of the asset in the coming couple of days.


We will explore how XLM stood its ground during this ongoing bearish cycle of the crypto market. But, initially, let’s look at Stellar’s function in the crypto ecosystem.
What’s the Function of Stellar (XLM)?
In order to link monetary systems across the globe and establish a framework for payment processors and investment firms, the network was officially inaugurated in 2015. The platform is designed to transport financial resources affordably, quickly, and reliably.
Users can produce, send, and exchange a variety of cryptocurrencies using Stellar, which connects individuals, financial institutions, and payment processors. The network's own digital currency, XLM or Lumens, serves as its foundation. XLM also serves as an intermediary coin for several activities.
Having explored the basic functionality of the crypto asset, let’s delve into the current market scenario to understand what can happen in the coming days.
Current Market Scenario
The current market scenario for the asset doesn’t look so good because the price of the asset has tanked more than 5% in a day. The asset is trading at around the $0.11 price mark with losses of more than 4% in its daily trading volume. XLM is among the few crypto assets that have failed to grab the attention of investors as the asset was about to touch the $1 price mark five years ago when it reached its all-time high. CoinMarketCap data shows that the asset was able to defy the bearish cycle with more than 7% of weekly gains. The asset is ranked 26th with a fully diluted market cap of more than $5 billion.
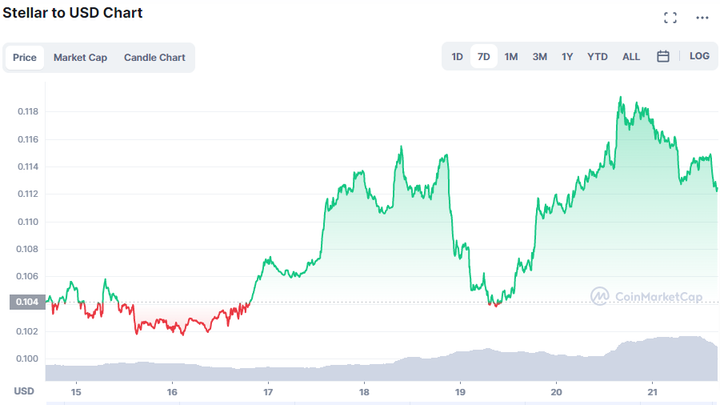
CoinMarketCap
It is safe to assume that September 20 will be a very turbulent day. Since March 2022, the Federal Open Market Committee (FOMC) has been fighting rising prices by increasing interest rates, and this pattern was expected to remain.
Investors had already anticipated a 75 bps increase, and anything more than that might start a serious sell-off. This is significant for Bitcoin [BTC] because, in recent months, BTC has tracked the S&P 500, and because the altcoin market frequently reflects BTC's mood. Stellar Lumens XLM short-term’s price charts demonstrated a negative inclination.
Let’s explore the technical side of the XLM ecosystem to predict the next path of the XLM.
What’s Next?
The market structure of XLM was optimistic on a higher timeframe, the four-hour chart. This showed that a trader might have a bullish bias on shorter time frames, like an hour. The upper cyan box indicates the location of a bullish order block at $0.112. Unfortunately for purchasers, the price immediately broke through this order block and may now act as resistance in the remaining trading hours. This would pave the way for yet another negative move for XLM.
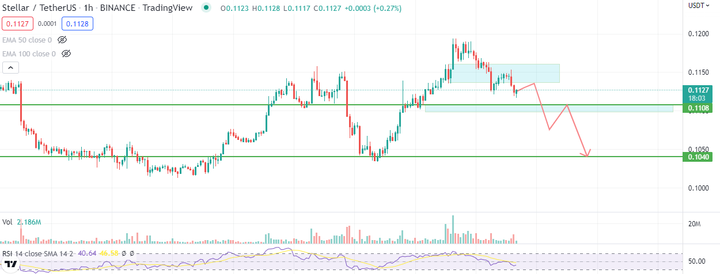
TradingView
At $0.11, another bullish order block was observed. From July to August, this area was likewise directly at a crucial support level. It should therefore serve as support once more, but a session close below it would likely portend the beginning of another move lower for XLM.
Technical Indicators
Short-term selling pressure was also indicated by the momentum indicators. The relative strength index (RSI) turned bearish when it fell below the neutral 50 level. Additionally, the Awesome Oscillator (AO) was about to cross the zero line.
The On-Balance Volume (OBV) held onto a support level that only a few days earlier was a resistance area. If the OBV dropped below this mark, seller dominance might be indicated. It is possible to expect further downward movement on the price charts.
Final Thoughts
The market may have already factored in a 75 basis point federal funds rate announcement. As a result, it's conceivable that the crypto markets have already experienced a wave of selling in anticipation of BTC falling to $18.8k. To regain support, Stellar Lumens must climb back up over the $0.115 level. If not, the sellers can swiftly gather momentum and drive the price as far as $0.105.
Discover more from CoinageReport
Subscribe to get the latest posts sent to your email.
This article is for informational purposes only and is not financial advice.


