
Where is the bitcoin bottom?
‘Where is the Bitcoin bottom?’ and ‘Is Bitcoin dead?’ were surging on Google due to the recent crypto crash. It has been over 8 months that Bitcoin has been plunging after recording an all-time high in November 2021.


Bitcoin sitting more than 70% below its all-time high has done exactly what you’d expect to sentiment — fear, uncertainty, and doubt are running the show. Here’s what the historical price cycles suggest about how much further this one has to run.
Before diving into speculation and prediction, let’s understand the current scenario.
How did it start?
It all started when Terra Luna’s UST stable coin experiment broke the peg. Terra Luna owned a huge quantity and to save the peg, the firm had to sell all their holding and buy back Luna and UST. That couldn’t save the peg; instead, the huge selling of Bitcoin pushed the whole market further down. This triggered a bearish response which is still ongoing.
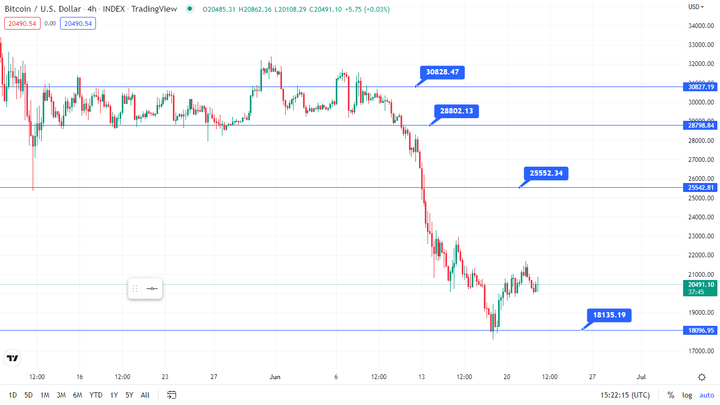
Bitcoin’s psychologically important support at $30,000 couldn’t hold back the downtrend for a longer period and therefore the first hope was the support of $28,000 and then the low of 12th May 2022 at $25,000. However, even these last support levels couldn’t hold back the bearish trend, and even old holders of Bitcoin began to panic.
Bitcoin: the current scenario
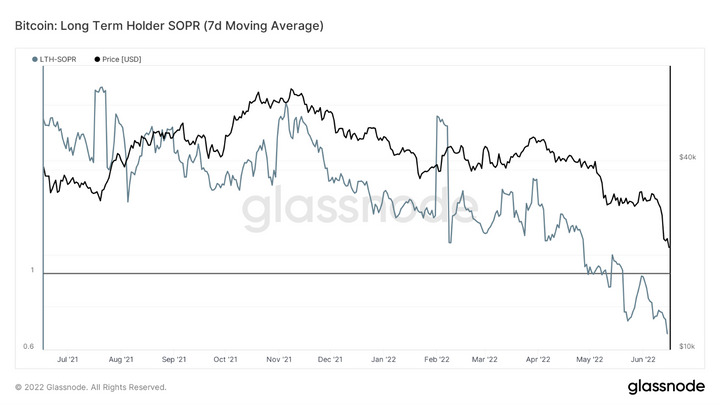
Even old Bitcoin holders started selling their holdings, pulling down the entire cryptocurrency market. Noelle Acheson, head of market insights at Genesis Global Trading, said in an interview that it was commonly thought that the long-term holders don’t panic sell as the short-term dumps don’t matter to them. But recent glass node on-chain data shows that those holders have been exiting the market at lower prices – most probably taking a loss. The last 7 days' chart shows that the long-term holder addresses are touching the bottoms. Around 500k Bitcoins were sold in the recent price dump, and out of these, 150K were sold by long-term holders.
Bitcoin has updated the lower low of the last 52 weeks, dropping below $18,000. The market has been showing a little recovery in the last few days, and Bitcoin is up over 17% from the local low. The FUDs in markets are letting big bulls pour their money in as they expect Bitcoin to drop further from the current level and update the bottom once more. This is why so many people are looking for the Bitcoin bottom. Let’s settle this debate once and for all.
Where is the Bitcoin Bottom?
A monthly chart shows that the price is already touching the lower trend line and taking in more volume here. The Moving Average 50 (30 days) is also playing support perfectly under the price movement. Bitcoin is currently ending the 3rd price pump and dump cycle since 2012. The average price cycle between one low to the next low is 43 candles/months, nearly 4 years.
Cycle 1:
- Bitcoin was at $2 in November 2011 and surged to $1200 in November 2013.
- Bitcoin dropped to $170 in August 2015 ending the first cycle.
- The cycle started in November 2011 and ended in August 2015.
Cycle 2:
- The second cycle started in September 2015 from Bitcoin at $170.
- Bitcoin rocketed to $19,000 in April 2018.
- Bitcoin dropped again to $3,300 in February 2019, ending the second cycle.
Cycle 3:
The current position
- Bitcoin started its journey in 2019 at $3,300.
- Bitcoin touched an all-time high of $69,000 on November 10, 2021.
Bitcoin’s bottom for this cycle is still in the making. It can take 1 to 2 more months to decide the bottom for Bitcoin. Considering the trend line and EMA 50 support, the bottom could be between $17,000 and $14,000 – followed by a gradual price surge to a new high.
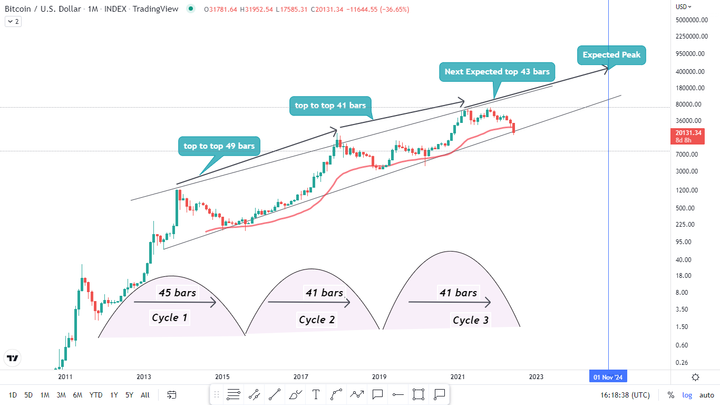
Eyeing the past data of Bitcoin, the distance between one peak to another peak is between 49 bars and 43 bars. Bitcoin is currently just 14 bars away from the last peak so it will take around 29 more months until it hits another cycle peak. The expected peak could be in November 2024.
Price-cycle analysis is only as reliable as the number of cycles behind it, and Bitcoin doesn’t have enough history to treat any single pattern as gospel. Still, if the historical rhythm holds, the next cycle could begin within a couple of months — which is exactly the kind of window long-term buyers tend to look back on as the opportunity.
Discover more from CoinageReport
Subscribe to get the latest posts sent to your email.
This article is for informational purposes only and is not financial advice.


